Test-Retest Reliability of Isokinetic Strength Measurement in Standardized and Lengthened Hamstring Positions Among Healthy Adults
Maria Belinda Cristina C. Fidel, Helen A. Banwell, Consuelo G. Suarez
Apr 2025 DOI 10.35460/2546-1621.2024-0176

Introduction
There is currently no consensus within literature on the etiological factors contributing to hamstring injuries.[1] Strength is among the most extensively studied modifiable risk factors for hamstring strain injuries, particularly emphasizing imbalances between the quadriceps and hamstrings as potential contributors.[2] Isokinetic dynamometers are widely recognized for their reliability and validity in assessing muscle strength,[3,4] making them the "gold standard" for comparison with other measurement tools.[5] However, research on isokinetic strength testing for predicting future hamstring strain injuries has yielded differing conclusions.
One commonly used measure is the conventional hamstring-to-quadriceps (H:Q) strength ratio, which compares concentric hamstring to concentric quadriceps strength. However, research on this ratio has produced conflicting results. For instance, Yeung, et al. (2009) found that a conventional H:Q ratio below 0.6 at 180°/sec resulted in a 17-fold increase in injury risk. [6]. In contrast, Van Dyk, et al. (2016) found no significant difference in this ratio between injured and uninjured limbs in a cohort of 614 elite soccer players. [7] The functional H:Q ratio, which compares eccentric hamstring to concentric quadriceps strength and aligns more closely with the hamstring's role in decelerating knee extension during running, also presents mixed evidence. Croisier, et al. (2002) identified significant imbalance in the functional H:Q ratio between injured and uninjured limbs in participants with a history of prior injury. [8] Conversely, Van Dyk, et al. (2016) found no predictive value for this ratio. [7]
Interlimb strength comparisons, which assess differences between the injured and uninjured limbs, have produced more consistent findings. Suguira, et al. (2008) reported that eccentric hamstring peak torque was significantly lower in the injured limb compared to the uninjured limb. [9] Similarly, Croisier, et al. (2008) found that bilateral asymmetry greater than 15% in concentric or eccentric hamstring torque was associated with 4-5 times higher risk of injury, which reduces significantly when the asymmetry is less than 5%. [10] Green, et al. (2018) also found that lower absolute and relative eccentric knee flexor torque at 60°/sec significantly predicted future hamstring strain injuries in sprint-related athletes. [11] In contrast, Green, et al. (2020) meta-analysis reported no significant association between isokinetic testing and hamstring strain injury risk. [12]
Previous work by the authorship team includes an umbrella review regarding the association between isokinetic strength and risk of hamstring strain injuries among running-related athletes (Fidel, et al., 2024). This work identified a small but significant association between reduced hamstring strength during lengthening contractions and increased risk of future hamstring injuries. However, a comprehensive review of the evidence found no clear link between general hamstring and quadriceps strength, their ratios and injury risk when tested in the traditional seated position with both hip and knee joints flexed at 90° using isokinetic dynamometers. Notably, we found that hamstring strength measurements significantly differ between injured and non-injured sides when tested in a lengthened position only, underscoring the impact of testing position on isokinetic strength outcomes. Consequently, the lengthened hamstring position, with the hip flexed at 85° and the knee at 30°, has gained recent attention for its potential relevance in hamstring assessment.[13-15]
Consistency in testing protocols is critical to ensuring that observed differences are due to actual participant variations rather than measurement inconsistencies. Test-retest reliability is vital for confirming that protocols can be consistently used in clinical or sports settings to allow clinicians, sports medicine professionals and trainers to make informed decisions regarding injury prevention, rehabilitation and return-to-sports planning. Therefore, this study aims to evaluate hamstring strength measurement protocols' test-retest reliability in standardized and lengthened positions over time.
Materials and Methods
Study Design
This was a test-retest reliability study to assess the stability of measurement protocols (standardized and lengthened positions) over time. All tests were conducted by one rater (BF), who performed the test and checked all settings before the initiation of the test. A research assistant was present to help with the computer setup and positioning of participants. The rater and research assistant completed a training program to become familiar with the testing device and procedures (eg, set up of the equipment and positioning of participants) before the study commenced.
Ethical Considerations
This study was approved by the Faculty of Pharmacy Research Ethics Committee at the University of Santo Tomas (FOPREC-2122-157). All participants provided written informed consent, and informed that they could withdraw from the study without consequences.
Study Site and Setting
All tests were performed at the Human Performance Laboratory on the fifth floor of the Fr. Roque Ruano building of the University of Santo Tomas, Espana Manila.
Outcome Measures of Interest
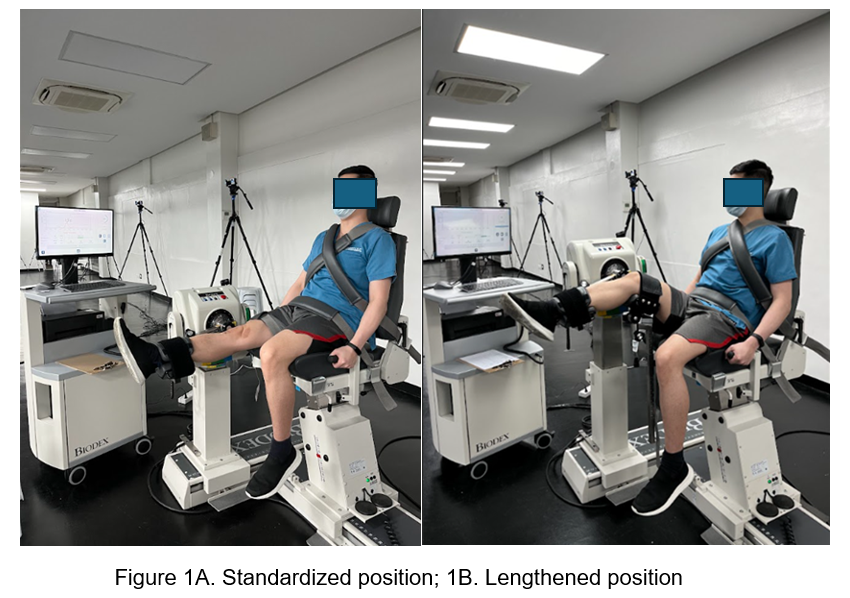
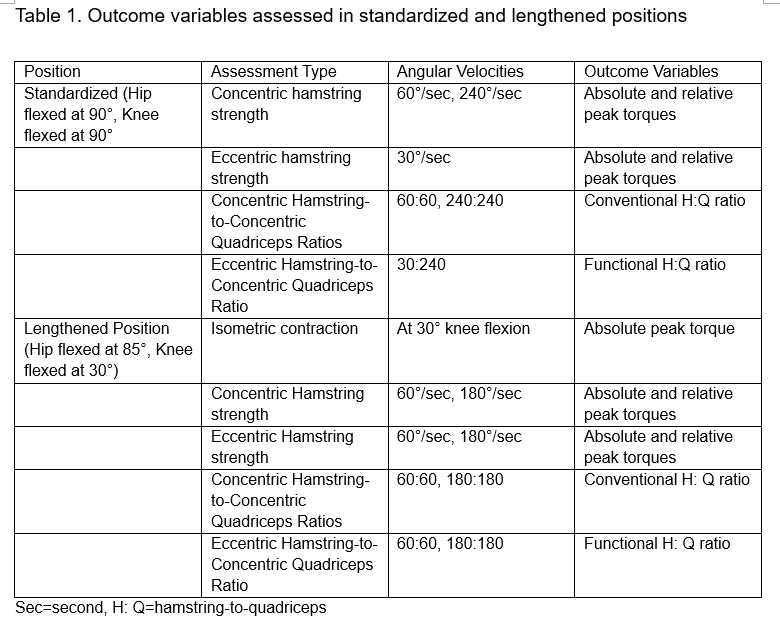
Table 1 summarizes the outcome measures for standardized (Figure 1. A) and lengthened (Figure 1. B) positions. The speeds of 60°/sec, 180°/sec and 240°/sec were chosen based on the umbrella review of systematic reviews as having the best evidence in predicting injury risk among athletes.
Table 1. Outcome variables assessed in standardized and lengthened positions
| Position | Assessment Type | Angular Velocities | Outcome Variables |
| Standardized (hip flexed at 90°, knee flexed at 90°) | Concentric hamstring strength | 60°/sec, 240°/sec | Absolute and relative peak torques |
| Eccentric hamstring strength | 30°/sec | Absolute and relative peak torques | |
| Concentric hamstring-to-concentric quadriceps ratios | 60:60, 240:240 | Conventional H:Q ratio | |
| Eccentric hamstring-to-concentric quadriceps ratio | 30:240 | Functional H:Q ratio | |
| Lengthened position (hip flexed at 85°, knee flexed at 30°) | Isometric contraction | At 30° knee flexion | Absolute peak torque |
| Concentric hamstring strength | 60°/sec, 180°/sec | Absolute and relative peak torques | |
| Eccentric hamstring strength | 60°/sec, 180°/sec | Absolute and relative peak torques | |
| Concentric hamstring-to-concentric quadriceps ratios | 60:60, 180:180 | Conventional H:Q ratio | |
| Eccentric hamstring-to-concentric quadriceps ratio | 60:60, 180:180 | Functional H:Q ratio |
Sec = second, H:Q = hamstring-to-quadriceps
A Biodex (System 4, Biodex Medical Systems, Shirley, New York, USA) isokinetic dynamometer was used for all testing. A lower extremity cycle ergometer (SportsArt C55R Recumbent Bike) was used for warm-up and cool-down procedures.
Since assessments were conducted in standardized and lengthened hamstring positions, a sequential approach was implemented to minimize setup time, reduce the need for frequent adjustments in participant positioning and enhance overall efficiency of testing procedure (see section below). Assessment in the standardized position was initially done for one leg, followed by the lengthened position. Subsequently, the sequence was reversed for the opposite leg, with the lengthened position followed by standardized position.
Participants
The study included healthy adult male and female participants aged 18 to 35 years. Participants were recruited through advertisements at the research center using convenience sampling. This approach selected readily available individuals who met the inclusion criteria of having no history of musculoskeletal conditions, injuries, or surgeries affecting the lower extremities. Individuals were excluded if they had any medical conditions or injuries that could interfere with isokinetic strength testing procedures.
Sample Size Computation
The sample size was computed based on the sample size calculator of Won Nar Arifin [15] using the hypothesis testing method, with a minimum acceptable ICC (ρ0) of 0.7, expected ICC (ρ1) of 0.95 based on the study of Feiring, et al.[16], α = 0.05, power of 80% and number of repetitions per subject = 2, a total of 10 participants had to be included.
Test Protocol
The study involved two identical testing sessions conducted three days apart. The tests were scheduled at similar times of the day to minimize potential effects of diurnal variations on participants’ performance. Participants were also instructed to maintain their regular physical activity schedule throughout the study period.
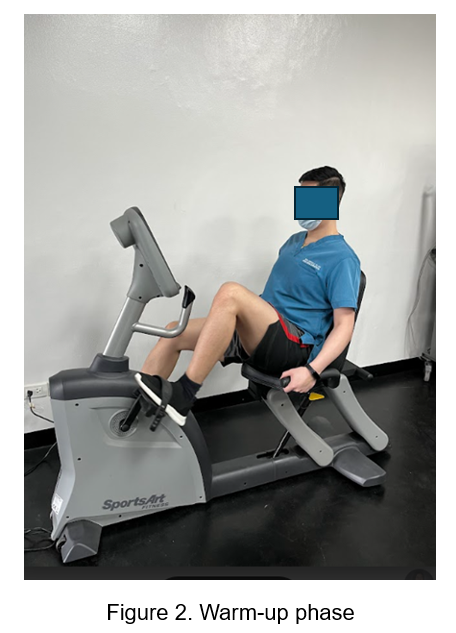
A warm-up phase consisting of a 5-minute cycle ergometer with target revolutions per minute between 50 and 60 was completed by each participant.
The participants were seated and stabilized using dual cross-over straps over the trunk, waist strap and a thigh strap on the test leg to restrict any lateral movement at the knee, allowing only flexion and extension movements. They were asked to grip the side handles of the chair to stabilize their upper body during the testing procedure. The lateral epicondyle of the femur was aligned with the fulcrum of the dynamometer. The tested leg was attached to the lever of the dynamometer with a Velcro strap placed 2 cm above the lateral malleolus. Each participant completed three submaximal trials of knee flexion and extension at each velocity, followed by two maximal contractions for familiarization with the task. They were given a 60-second rest before actual testing. Five maximal concentric isokinetic repetitions were used for data collection at all speeds. A 90-second rest period was given in between the protocols and a 180-second break between the standardized and lengthened positions.
Prior to the start of the test and during rest intervals preceding each protocol, participants received instructions to exert maximum force rapidly against the shin pad (“to push as hard and as fast as possible”) throughout the entire movement, with additional verbal countdown given (3—2—1—go). Throughout the test, no verbal encouragement was provided; however, the dynamometer computer screen was positioned to allow participants to observe real-time feedback on their exertion.
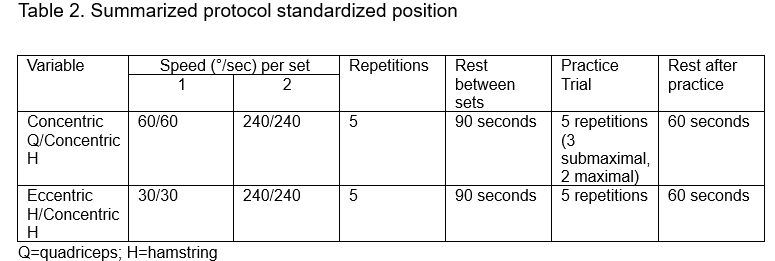
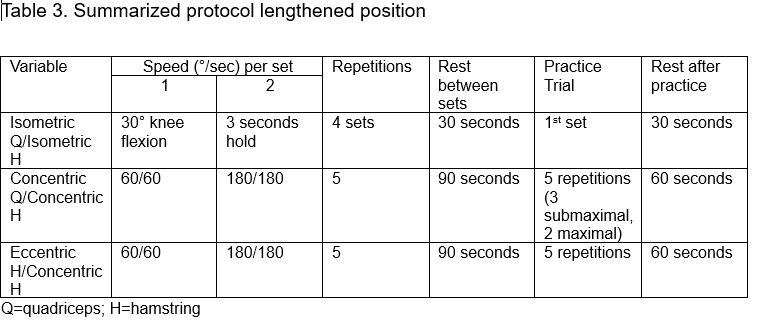
All contractions were executed within a standardized range of knee motion. Torques were adjusted to account for the effects of gravity. Participants engaged in a cool-down session of a 5-minute leg ergometer following the test. Tables 2 and 3 summarize the protocols used in isokinetic strength measurement in the standardized and lengthened positions.
Table 2. Summarized protocol standardized position
| Variable |
Speed (°/sec) per set |
Repetitions | Rest between sets | Practice trial | Rest after practice | |
|
1 |
2 |
|||||
| Concentric Q/Concentric H | 60/60 | 240/240 | 5 | 90 seconds | 5 repetitions (3 submaximal, 2 maximal) | 60 seconds |
| Eccentric H/Concentric H | 30/30 | 240/240 | 5 | 90 seconds | 5 repetitions | 60 seconds |
Q = quadriceps; H = hamstring
Table 3. Summarized protocol lengthened position
| Variable |
Speed (°/sec) per set |
Repetitions | Rest between sets | Practice trial | Rest after practice | |
|
1 |
2 |
|||||
| Isometric Q/Isometric H | 30° knee flexion | 3 seconds hold | 4 sets | 30 seconds | 1st set | 30 seconds |
| Concentric Q/Concentric H | 60/60 | 180/180 | 5 | 90 seconds | 5 repetitions (3 submaximal, 2 maximal) | 60 seconds |
| Eccentric H/Concentric H | 60/60 | 180/180 | 5 | 90 seconds | 5 repetitions | 60 seconds |
Q = quadriceps; H = hamstring
Data Management
To ensure blinding, the rater conducted all testing but was blinded to measured outcomes, a research assistant calculated all outcomes but was blinded to the condition when measured. Each participant was assigned a unique identification code; no personally identifiable information was stored with the measurement data.
The data were recorded and organized in a Microsoft Excel spreadsheet, including participant codes, demographic information (age, sex, height, weight) and isokinetic strength measurements (concentric and eccentric peak torque, conventional and functional strength ratios). The Excel spreadsheet was stored securely on a password-protected dedicated computer, with a backup copy saved on an external hard drive to prevent data loss.
Data Analysis
Data was analyzed using IBM SPSS Statistics 21 (IBM Corp., 2012). The means and standard deviations were reported to summarize the data. A repeated measures analysis of variance was used to determine any significant difference in measurements of the same variable (day 1 vs. day 2). F-values and p-values were computed. For intra-rater reliability, the association between measurements by a single rater was analyzed using a two-way mixed effects model (with absolute agreement) where people's effects are random and measures' effects are fixed. ICC [2,1] (single-rater, average-measure, ICC mixed) with a single rater providing ratings on multiple trials model was used. ICC values were classified as poor if they were less than 0.5, moderate if they were between 0.5 and 0.75, good if they were between 0.75 and 0.90 and excellent if they were greater than 0.90.[17]
Results
Ten healthy active participants (six males and four females; mean age: 26.5 ± 4.03 years; height: 1.67 ± 0.09 meters; weight: 69.9 ± 9.9 kilograms; BMI: 25 ± 1) with no history of lower extremity injury were recruited for the study.
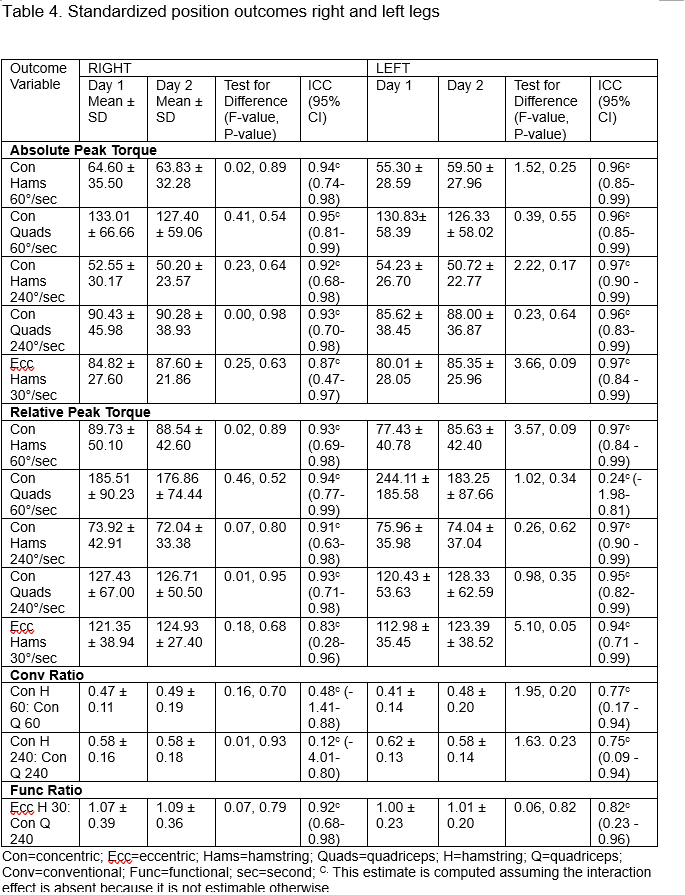
Mean absolute and relative peak torque values were generally higher for the quadriceps than hamstrings during concentric contractions at 60°/sec. For quadriceps, absolute and relative peak torque values in the concentric mode at 60°/sec were higher in the standardized than lengthened position. Conversely, for the hamstrings, both absolute and relative peak torque values at 60°/sec were higher in the lengthened position compared to the standardized position.
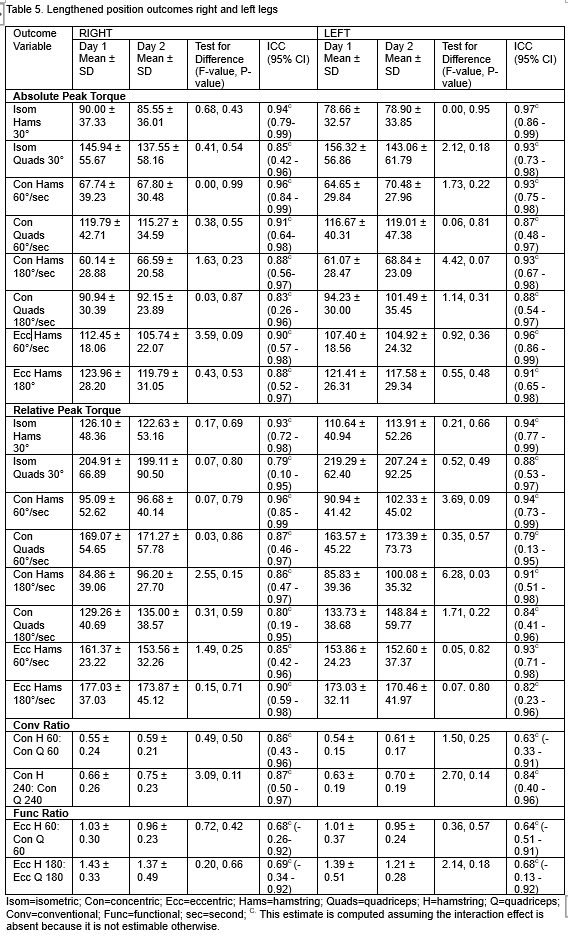
The ICC values demonstrated good to excellent reliability for most absolute and relative peak torque measurements in both positions, with generally higher ICC values in the standardized position (ICC 0.83-0.94) than in the lengthened position (ICC 0.79-0.96). There is some variability in the reliability of conventional and functional ratios, with slightly lower ICCs observed in the standardized position, particularly for the right leg (ICC 0.32-0.92) compared to the lengthened position, which demonstrated moderate to good reliability (ICC 0.63-0.87). Overall, both positions exhibit strong reliability for isokinetic strength measurements. Tables 4 and 5 summarize the descriptive and reliability data for standardized and lengthened positions.
Table 4. Standardized position outcomes right and left legs
|
Outcome Variable |
RIGHT | LEFT | ||||||
|
Day 1 Mean ± SD |
Day 2 Mean ± SD |
Test for Difference (F-value, P-value) | ICC (95% CI) | Day 1 | Day 2 | Test for Difference (F-value, P-value) | ICC (95% CI) | |
| Absolute Peak Torque | ||||||||
| Con Hams 60°/sec | 64.60 ± 35.50 | 63.83 ± 32.28 | 0.02, 0.89 | 0.94c(0.74-0.98) | 55.30 ± 28.59 | 59.50 ± 27.96 | 1.52, 0.25 | 0.96c(0.85-0.99) |
| Con Quads 60°/sec | 133.01 ± 66.66 | 127.40 ± 59.06 | 0.41, 0.54 | 0.95c(0.81-0.99) | 130.83± 58.39 | 126.33 ± 58.02 | 0.39, 0.55 | 0.96c(0.85-0.99) |
| Con Hams 240°/sec | 52.55 ± 30.17 | 50.20 ± 23.57 | 0.23, 0.64 | 0.92c(0.68-0.98) | 54.23 ± 26.70 | 50.72 ± 22.77 | 2.22, 0.17 | 0.97c (0.90-0.99) |
| Con Quads 240°/sec | 90.43 ± 45.98 | 90.28 ± 38.93 | 0.00, 0.98 | 0.93c(0.70-0.98) | 85.62 ± 38.45 | 88.00 ± 36.87 | 0.23, 0.64 | 0.96c (0.83-0.99) |
| Ecc Hams 30°/sec | 84.82 ± 27.60 | 87.60 ± 21.86 | 0.25, 0.63 | 0.87c(0.47-0.97) | 80.01 ± 28.05 | 85.35 ± 25.96 | 3.66, 0.09 | 0.97c(0.84-0.99) |
| Relative Peak Torque | ||||||||
| Con Hams 60°/sec | 89.73 ± 50.10 | 88.54 ± 42.60 | 0.02, 0.89 | 0.93c(0.69-0.98) | 77.43 ± 40.78 | 85.63 ± 42.40 | 3.57, 0.09 | 0.97c(0.84-0.99) |
| Con Quads 60°/sec | 185.51 ± 90.23 |
176.86 ± 74.44
|
0.46, 0.52 | 0.94c(0.77-0.99) | 244.11 ± 185.58 | 183.25 ± 87.66 | 1.02, 0.34 | 0.24c(-1.98-0.81) |
| Con Hams 240°/sec | 73.92 ± 42.91 | 72.04 ± 33.38 | 0.07, 0.80 | 0.91c(0.63-0.98) | 75.96 ± 35.98 | 74.04 ± 37.04 | 0.26, 0.62 | 0.97c(0.90-0.99) |
| Con Quads 240°/sec | 127.43 ± 67.00 | 126.71 ± 50.50 | 0.01, 0.95 | 0.93c(0.71-0.98) | 120.43 ± 53.63 | 128.33 ± 62.59 | 0.98, 0.35 | 0.95c(0.82-0.99) |
| Ecc Hams 30°/sec | 121.35 ± 38.94 | 124.93 ± 27.40 | 0.18, 0.68 | 0.83c(0.28-0.96) | 112.98 ± 35.45 | 123.39 ± 38.52 | 5.10, 0.05 | 0.94c(0.71-0.99) |
| Conv Ratio | ||||||||
| Con H 60: Con Q 60 | 0.47 ± 0.11 | 0.49 ± 0.19 | 0.16, 0.70 | 0.48c(-1.41-0.88) | 0.41 ± 0.14 | 0.48 ± 0.20 | 1.95, 0.20 | 0.77c(0.17-0.94) |
| Con H 240: Con Q 240 | 0.58 ± 0.16 | 0.58 ± 0.18 | 0.01, 0.93 | 0.12c(-4.01-0.80) | 0.62 ± 0.13 | 0.58 ± 0.14 | 1.63. 0.23 | 0.75c(0.09-0.94) |
| Func Ratio | ||||||||
| Ecc H 30: Con Q 240 | 1.07 ± 0.39 | 1.09 ± 0.36 | 0.07, 0.79 | 0.92c(0.68-0.98) | 1.00 ± 0.23 | 1.01 ± 0.20 | 0.06, 0.82 | 0.82c(0.23-0.96) |
Con = concentric; Ecc = eccentric; Hams = hamstring; Quads = quadriceps; H = hamstring; Q = quadriceps; Conv = conventional; Func = functional; sec = second;
C This estimate is computed assuming the interaction effect is absent because it is not estimable otherwise.
Table 5. Lengthened position outcomes right and left legs
|
Outcome Variable |
RIGHT | LEFT | ||||||
|
Day 1 Mean ± SD |
Day 2 Mean ± SD |
Test for Difference (F-value, P-value) | ICC (95% CI) |
Day 1 Mean ± SD |
Day 2 Mean ± SD |
Test for Difference (F-value, P-value) | ICC (95% CI) | |
| Absolute Peak Torque | ||||||||
|
Isom Hams 30° |
90.00 ± 37.33 | 85.55 ± 36.01 | 0.68, 0.43 | 0.94c(0.79-0.99) | 78.66 ± 32.57 | 78.90 ± 33.85 | 0.00, 0.95 | 0.97c(0.86-0.99) |
| Isom Quads 30° | 145.94 ± 55.67 | 137.55 ± 58.16 | 0.41, 0.54 | 0.85c(0.42-0.96) | 156.32 ± 56.86 | 143.06 ± 61.79 | 2.12, 0.18 | 0.93c(0.73-0.98) |
| Con Hams 60°/sec | 67.74 ± 39.23 |
67.80 ± 30.48
|
0.00, 0.99 | 0.96c(0.84-0.99) | 64.65 ± 29.84 | 70.48 ± 27.96 | 1.73, 0.22 | 0.93c(0.75-0.98) |
| Con Quads 60°/sec | 119.79 ± 42.71 | 115.27 ± 34.59 | 0.38, 0.55 | 0.91c(0.64-0.98) | 116.67 ± 40.31 | 119.01 ± 47.38 | 0.06, 0.81 | 0.87c(0.48-0.97) |
| Con Hams 180°/sec | 60.14 ± 28.88 | 66.59 ± 20.58 | 1.63, 0.23 | 0.88c(0.56-0.97) | 61.07 ± 28.47 | 68.84 ± 23.09 | 4.42, 0.07 | 0.93c(0.67-0.98) |
| Con Quads 180°/sec | 90.94 ± 30.39 | 92.15 ± 23.89 | 0.03, 0.87 | 0.83c(0.26-0.96) | 94.23 ± 30.00 | 101.49 ± 35.45 | 1.14, 0.31 | 0.88c(0.54-0.97) |
| Ecc Hams 60°/sec | 112.45 ± 18.06 | 105.74 ± 22.07 | 3.59, 0.09 | 0.90c(0.57-0.98) | 107.40 ± 18.56 | 104.92 ± 24.32 | 0.92, 0.36 | 0.96c(0.86-0.99) |
| Ecc Hams 180° | 123.96 ± 28.20 | 119.79 ± 31.05 | 0.43, 0.53 | 0.88c(0.52-0.97) | 121.41 ± 26.31 | 117.58 ± 29.34 | 0.55, 0.48 | 0.91c(0.65-0.98) |
| Relative Peak Torque | ||||||||
|
Isom Hams 30° |
126.10 ± 48.36 | 122.63 ± 53.16 | 0.17, 0.69 | 0.93c(0.72-0.98) | 110.64 ± 40.94 | 113.91 ± 52.26 | 0.21, 0.66 | 0.94c(0.77-0.99) |
| Isom Quads 30° | 204.91 ± 66.89 | 199.11 ± 90.50 | 0.07, 0.80 | 0.79c(0.10-0.95) | 219.29 ± 62.40 | 207.24 ± 92.25 | 0.52, 0.49 | 0.88c(0.53-0.97) |
| Con Hams 60°/sec | 95.09 ± 52.62 | 96.68 ± 40.14 | 0.07, 0.79 | 0.96c(0.85-0.99 | 90.94 ± 41.42 | 102.33 ± 45.02 | 3.69, 0.09 | 0.94c(0.73-0.99) |
| Con Quads 60°/sec | 169.07 ± 54.65 | 171.27 ± 57.78 | 0.03, 0.86 | 0.87c(0.46-0.97) | 163.57 ± 45.22 | 173.39 ± 73.73 | 0.35, 0.57 | 0.79c(0.13-0.95) |
| Con Hams 180°/sec | 84.86 ± 39.06 | 96.20 ± 27.70 | 2.55, 0.15 | 0.86c(0.47-0.97) | 85.83 ± 39.36 | 100.08 ± 35.32 | 6.28, 0.03 | 0.91c(0.51-0.98) |
| Con Quads 180°/sec | 129.26 ± 40.69 | 135.00 ± 38.57 | 0.31, 0.59 | 0.80c(0.19-0.95) | 133.73 ± 38.68 | 148.84 ± 59.77 | 1.71, 0.22 | 0.84c(0.41-0.96) |
| Ecc Hams 60°/sec | 161.37 ± 23.22 | 153.56 ± 32.26 | 1.49, 0.25 | 0.85c(0.42-0.96) | 153.86 ± 24.23 | 152.60 ± 37.37 | 0.05, 0.82 | 0.93c(0.71-0.98) |
| Ecc Hams 180°/sec | 177.03 ± 37.03 | 173.87 ± 45.12 | 0.15, 0.71 | 0.90c(0.59-0.98) | 173.03 ± 32.11 | 170.46 ± 41.97 | 0.07. 0.80 | 0.82c(0.23-0.96) |
| Conv Ratio | ||||||||
| Con H 60: Con Q 60 | 0.55 ± 0.24 | 0.59 ± 0.21 | 0.49, 0.50 | 0.86c(0.43-0.96) | 0.54 ± 0.15 | 0.61 ± 0.17 | 1.50, 0.25 | 0.63c(-0.33-0.91) |
| Con H 240: Con Q 240 | 0.66 ± 0.26 | 0.75 ± 0.23 | 3.09, 0.11 | 0.87c(0.50-0.97) | 0.63 ± 0.19 | 0.70 ± 0.19 | 2.70, 0.14 | 0.84c(0.40-0.96) |
| Func Ratio | ||||||||
|
Ecc H 60: Con Q 60 |
1.03 ± 0.30 | 0.96 ± 0.23 | 0.72, 0.42 | 0.68c (-0.26-0.92) | 1.01 ± 0.37 | 0.95 ± 0.24 | 0.36, 0.57 | 0.64c(-0.51-0.91) |
| Ecc H 180: Ecc Q 180 | 1.43 ± 0.33 | 1.37 ± 0.49 | 0.20, 0.66 | 0.69c(-0.34-0.92) | 1.39 ± 0.51 | 1.21 ± 0.28 | 2.14, 0.18 | 0.68c(-0.13-0.92) |
Isom = isometric; Con = concentric; Ecc = eccentric; Hams = hamstring; Quads = quadriceps; H = hamstring; Q = quadriceps; Conv = conventional; Func = functional; sec = second;
C This estimate is computed assuming the interaction effect is absent because it is not estimable otherwise.
Discussion
This study provides reliable and consistent protocols for measuring absolute and relative peak torque of both hamstring and quadriceps muscles during concentric and eccentric contractions across slow, intermediate and fast speeds. It also covers the assessment of conventional and functional strength ratios in standardized and lengthened positions with the evaluation of isometric peak torque, specifically in the lengthened position. The standardized test had more excellent ICC values than the lengthened test, which was mostly good.
The excellent reliability for peak torque measurements in the standardized position and the generally good reliability in lengthened position indicate their effectiveness for consistent and reproducible results. To our knowledge, this is the first study to assess the test-retest reliability for knee flexion and extension using the lengthened position. The stability and reliability of both protocols for repeated measures are crucial for longitudinal studies and clinical evaluations.
The variability in reliability of conventional and functional ratios could reflect differences in how these ratios are influenced by the test position or by individual anatomical or functional factors. This suggests that while absolute and relative peak torque values may be reliable, ratios derived from these measurements might be more sensitive to the position or other factors. Impellizzerri, et al. (2008) investigated the reliability of the conventional ratio at 60°, 120° and 180°/sec and the functional ratio at 60°/sec in 18 recreational adult athletes. [18] Their findings demonstrated low-to-moderate reliability, with greater reproducibility at slower speeds than faster ones. Specifically, the ICC for conventional ratio on the right side was 0.79 at 60°/sec, 0.70 at 120°/sec and 0.34 at 180°/sec, while for the left side, it was 0.65, 0.55 and 0.44, respectively. [11] Similarly, our study examining the reliability of conventional ratio in the standardized position showed comparable results, with ICC values of 0.48 for the right and 0.77 for the left at 60°/sec; 0.12 for the right and 0.75 for the left at 240°/sec. These findings align with the patterns observed by Impellizzerri, et al., highlighting the influence of speed on reliability of the conventional ratio. [18] There is generally better neuromuscular control at slower speeds, allowing for more consistent and reproducible contractions. As speed increases, muscle control and coordination may decrease, leading to greater variability in force production and lower measurement reliability.
Our study is limited by its focus on young, physically active and healthy adult participants, which restricts the generalizability of findings to other age groups or clinical populations. Future research should include a broader range of participants to determine if the results are consistent across different demographics and those with varying health conditions.
Conclusion
Our study demonstrates that standardized and lengthened positions provide reliable and stable assessments of absolute and relative peak torque for the hamstring and quadriceps muscles during concentric and eccentric contractions across slow, intermediate and fast speeds, though the standardized position yielded slightly higher reliability compared to the lengthened position. This includes the evaluation of conventional and functional strength ratios, as well as isometric knee flexion in the lengthened position.
Declaration of Competing Interests
This study is funded by DOST-PCHRD.
Author’s Contributions
1. Research Project: A. Conception, B. Organization, C. Execution.
2. Statistical Analysis: A. Design, B. Execution, C. Review and Critique.
3. Manuscript Preparation: A. Writing the First Draft, B. Review and Critique.
M.B.C.F.: 1A, 1B, 1C, 2A, 2B, 3A, 3B
C.G.S: 1A, 1B, 2A, 2B, 2C, 3B
H.A.B: 2A, 2C, 3B
- Perkins S, Canavan P. Isokinetic assessment of knee flexor and extensor strength and lower extremity flexibility assessment of an NCAA Division III men’s soccer team. Int J Sports Phys Ther [Internet]. 2023;V18(3):626–35. Available from: http://dx.doi.org/10.26603/001c.74971
- Baumgart C, Kurz E, Freiwald J, Hoppe MW. Effects of hip flexion on knee extension and flexion isokinetic angle-specific torques and HQ-ratios. Sports Med Open [Internet]. 2021;7(1):41. Available from: http://dx.doi.org/10.1186/s40798-021-00330-w
- Pincivero DM, Lephart SM, Karunakara RA. Reliability and precision of isokinetic strength and muscular endurance for the quadriceps and hamstrings. Int J Sports Med [Internet]. 1997;18(2):113–7. Available from: http://dx.doi.org/10.1055/s-2007-972605
- Toonstra J, Mattacola CG. Test-retest reliability and validity of isometric knee-flexion and -extension measurement using 3 methods of assessing muscle strength. J Sport Rehabil [Internet]. 2013;22(1). Available from: http://dx.doi.org/10.1123/jsr.2013.tr7
- Parraca JA, Adsuar JC, Domínguez-Muñoz FJ, Barrios-Fernandez S, Tomas-Carus P. Test-retest reliability of isokinetic strength measurements in lower limbs in elderly. Biology (Basel) [Internet]. 2022;11(6):802. Available from: http://dx.doi.org/10.3390/biology11060802
- Yeung SS, Suen AM, Yeung EW. A prospective cohort study of hamstring injuries in competitive sprinters: preseason muscle imbalance as a possible risk factor. Br. J. Sports Med. 2009 Aug 1;43(8):589-94.
- Van Dyk N, Bahr R, Whiteley R, Tol JL, Kumar BD, Hamilton B, Farooq A, Witvrouw E. Hamstring and quadriceps isokinetic strength deficits are weak risk factors for hamstring strain injuries: a 4-year cohort study. Am. J. Sports Med. 2016 Jul;44(7):1789-95.
- Croisier JL, Forthomme B, Namurois MH, Vanderthommen M, Crielaard JM. Hamstring muscle strain recurrence and strength performance disorders. Am. J. of Sports Med. 2002 Mar;30(2):199-203.
- Sugiura Y, Saito T, Sakuraba K, Sakuma K, Suzuki E. Strength deficits identified with concentric action of the hip extensors and eccentric action of the hamstrings predispose to hamstring injury in elite sprinters. J. Orthop. Sports Phys. Ther. 2008 Aug;38(8):457-64.
- Croisier JL, Ganteaume S, Binet J, Genty M, Ferret JM. Strength imbalances and prevention of hamstring injury in professional soccer players: a prospective study. Am. J. Sports Med. 2008 Aug;36(8):1469-75.
- Green B, Bourne MN, Pizzari T. Isokinetic strength assessment offers limited predictive validity for detecting risk of future hamstring strain in sport: a systematic review and meta-analysis. Br. J. Sports Med. 2018 Mar 1;52(5):329-36.
- Green B, Bourne MN, Van Dyk N, Pizzari T. Recalibrating the risk of hamstring strain injury (HSI): A 2020 systematic review and meta-analysis of risk factors for index and recurrent hamstring strain injury in sport. Br. J. Sports Med. 2020 Sep 1;54(18):1081-8.
- Correia P, Santos P, Mil-Homens P, Gomes M, Dias A, Valamatos MJ. Rapid hamstrings to quadriceps ratio at long muscle lengths in professional football players with previous hamstring strain injury. EJSS (Champaign) [Internet]. 2020;20(10):1405–13. Available from: http://dx.doi.org/10.1080/17461391.2020.1714741
- Nara G, Samukawa M, Oba K, Koshino Y, Ishida T, Kasahara S, et al. The deficits of isometric knee flexor strength in lengthened hamstring position after hamstring strain injury. Phys Ther Sport [Internet]. 2022;53:91–6. Available from: https://doi.org/10.1016/j.ptsp.2021.11.011
- Arifin WN, Unit of Biostatistics and Research Methodology, School of Medical Sciences, Universiti Sains Malaysia, Kelantan, MALAYSIA. A web-based sample size calculator for reliability studies. Educ Med J [Internet]. 2018;10(3):67–76. Available from: http://dx.doi.org/10.21315/eimj2018.10.3.8
- Feiring DC, Ellenbecker TS, Derscheid GL. Test-retest reliability of the biodex isokinetic dynamometer. J Orthop Sports Phys Ther [Internet]. 1990;11(7):298–300. Available from: http://dx.doi.org/10.2519/jospt.1990.11.7.298
- Koo TK, Li MY. A guideline of selecting and reporting intraclass correlation coefficients for reliability research. J Chiropr Med [Internet]. 2016;15(2):155–63. Available from: http://dx.doi.org/10.1016/j.jcm.2016.02.012
- Impellizzeri FM, Bizzini M, Rampinini E, Cereda F, Maffiuletti NA. Reliability of isokinetic strength imbalance ratios measured using the Cybex NORM dynamometer. Clin Physiol Funct Imaging [Internet]. 2008;28(2):113–9. Available from: http://dx.doi.org/10.1111/j.1475-097X.2007.00786.x
Tables and Figures
![]() Open Access This article is licensed under a Creative Commons Attribution-NonCommercial-ShareAlike 4.0
International License, which permits use, share — copy and redistribute the material in any medium or format,
adapt — remix, transform, and build upon the material, as long as you give appropriate credit,
provide a link to the license, and indicate if changes were made. You may do so in any reasonable manner,
but not in any way that suggests the licensor endorses you or your use. You may not use the material for
commercial purposes. If you remix, transform, or build upon the material, you must distribute your
contributions under the same license as the original. You may not apply legal terms or technological
measures that legally restrict others from doing anything the license permits. The images or other
third party material in this article are included in the article’s Creative Commons license, unless indicated
otherwise in a credit line to the material. If material is not included in the article’s Creative Commons
license and your intended use is not permitted by statutory regulation or exceeds the permitted use,
you will need to obtain permission directly from the copyright holder. To view a copy of this license,
visit https://creativecommons.org/licenses/by-nc-sa/4.0/.
Open Access This article is licensed under a Creative Commons Attribution-NonCommercial-ShareAlike 4.0
International License, which permits use, share — copy and redistribute the material in any medium or format,
adapt — remix, transform, and build upon the material, as long as you give appropriate credit,
provide a link to the license, and indicate if changes were made. You may do so in any reasonable manner,
but not in any way that suggests the licensor endorses you or your use. You may not use the material for
commercial purposes. If you remix, transform, or build upon the material, you must distribute your
contributions under the same license as the original. You may not apply legal terms or technological
measures that legally restrict others from doing anything the license permits. The images or other
third party material in this article are included in the article’s Creative Commons license, unless indicated
otherwise in a credit line to the material. If material is not included in the article’s Creative Commons
license and your intended use is not permitted by statutory regulation or exceeds the permitted use,
you will need to obtain permission directly from the copyright holder. To view a copy of this license,
visit https://creativecommons.org/licenses/by-nc-sa/4.0/.